Walksites vs Average Household income:
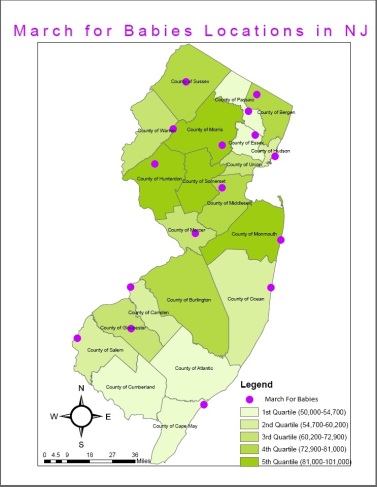
This map features the March for Babies in New Jersey for the year 2011, in relation to the median income of each county.
As per the distribution of the ma p, one can conclude that most of the March for Babies Walks took place in counties with a high median household income. There are, however, a few sites where this is not the case, and as such, median family income does not completely correlate with the location of the walks.
Walksites vs Population
This map distribution shows that most of the March for Babies Walks are held in NJ counties which have a high income.
_______
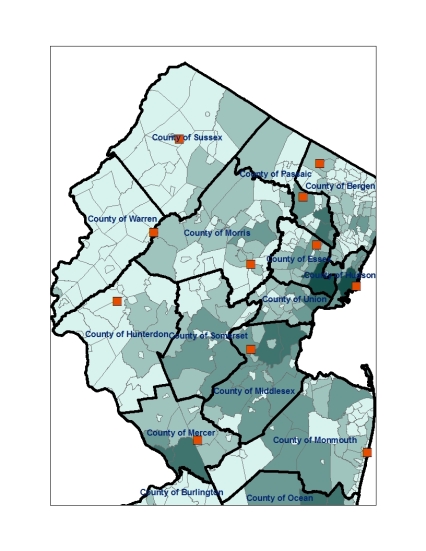
The map to the top left of the top half of New Jersey. The Orange Squares represent the walk sites and the shades of blue (from light to dark) represent the income level, low to high respectively.
After observing the walksite locations in each county, one can see that locations are such that the walksite is in an area of the county that is relatively more populated. This can be seen most distinctly in the couties of Mercer, Middlesex and Hudson. For Essex and Morris, the walk-sites are not in the most densely populated area, but is in a relatively populated area. The only counties that defies this trend is Hunterdon and Warren.County.
The map on the top right shows similar trends in Camden, Gloucestor and Ocean. Cape May and Salem does not follow the trend.
_____________________________________________________________________________________________________________________________________________________________
The March for Babies’ goal is to raise money to fund the March of Dimes as well as encourage people to walk for babies. By holding the walks in populated sites, the March of Dimes can ensure a greater amount of people will join the walk. In addition, the more people that are present, the more money can be raised. Thus far, most of the walks that were held in the year 2011, we held in the location of the county that has a relatively high population.


